Infographic: University graduates

With a nation grappling with a solution to providing higher education to all, we have an objective look at university graduates in South Africa and how to target them through media.

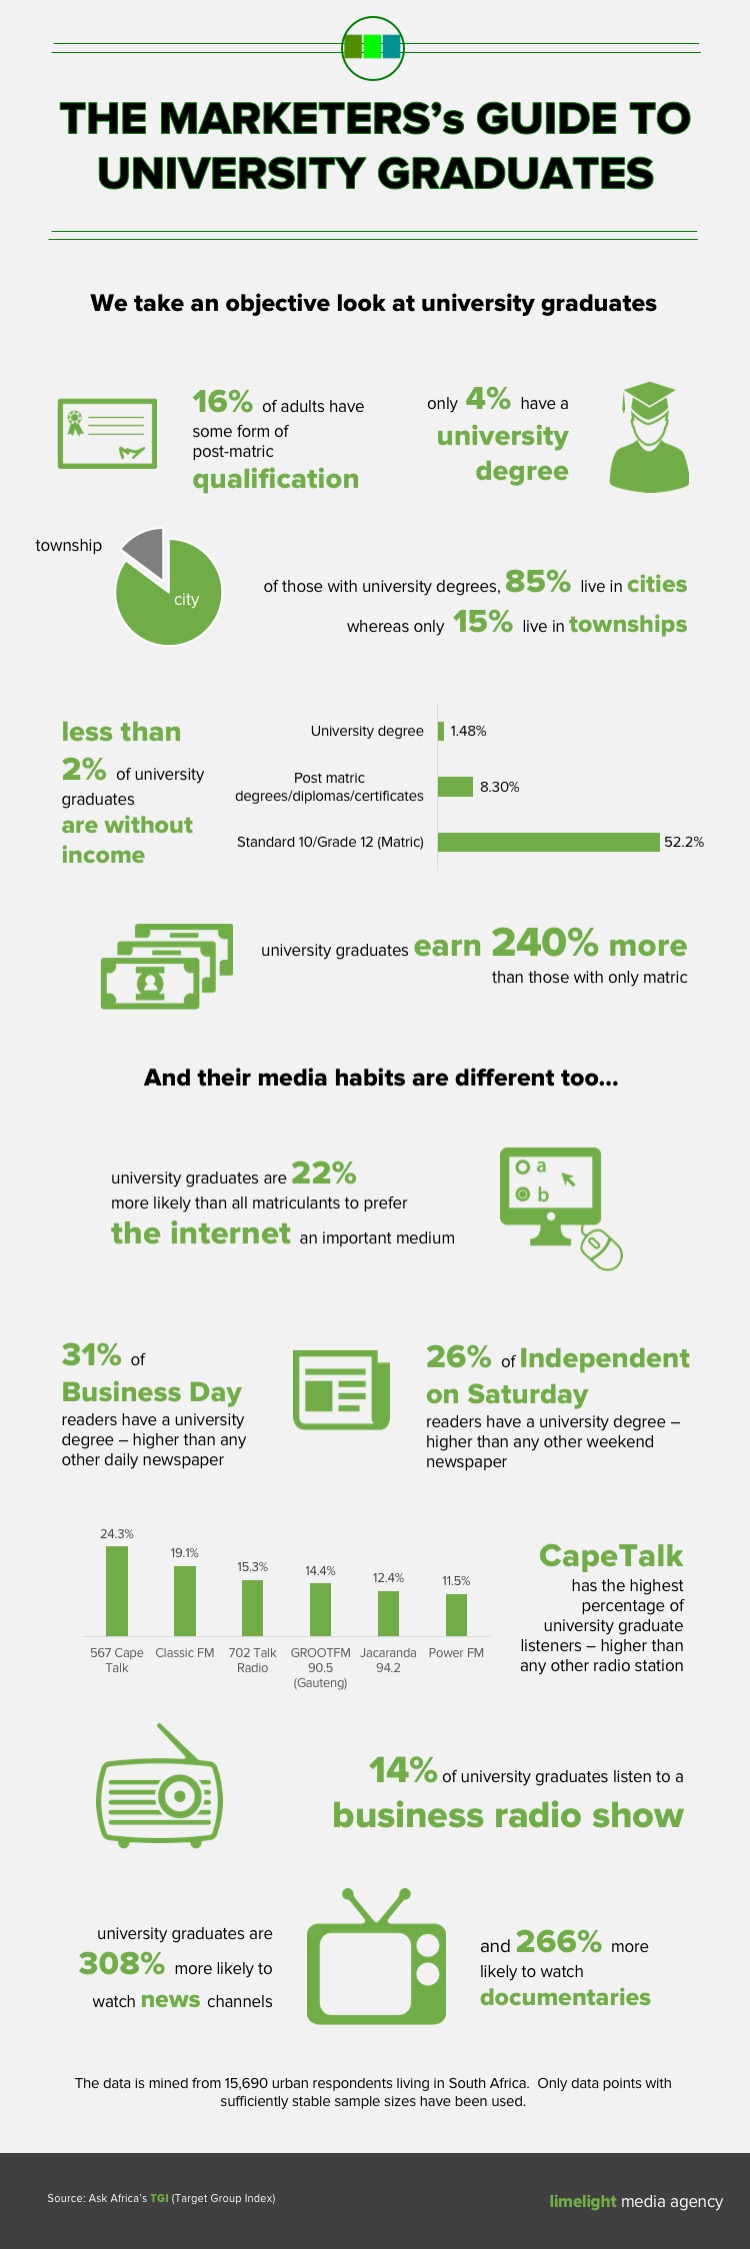
Firstly, and sadly, they are a small minority of our country.  Only 16% of urban adults have some for of post-matric qualification and only 4% have a university degree.

These university graduates live mostly in the cities (85%) whereas only 15% live in townships.

A university education has a profound effect on one’s earning capacity – shown by the fact that only 2% of university graduates are without a personal income and those that do have an income, earn 240% more than the average matriculant.

Their media habits, too, are different.  University graduates are 22% more likely to prefer the Internet as an important medium of communication.

Amongst newspapers, Business Day is the daily newspaper which has the most readers with a university degree (31% of readers) whereas the Independent on Saturday is the weekend newspaper with the highest percentage (26%).

Amongst radio stations, CapeTalk stands out high with the highest percentage of listeners with a university degree (24%) but is followed closely ClassicFM, 702, GrootFM, Jacaranda and Power FM.  Furthermore, 14% of university graduates listen to business radio shows.

General television viewership doesn’t change much but specific DSTV channels do – university graduates are 308% more likely to watch news channels and 266% more likely to watch documentaries.

Infographic: Marketer’s Guide to SA Rugby Supporters

For any South African marketer, it’s important to understand the relevance of major sports rugby, cricket, and soccer, to consumers. What is really interesting from a media approach is that fans of each sport are different and a one-size-fits-all approach won’t cut it with campaigns around sport.

We take an objective look at South Africa’s second most popular spectator sport – rugby.

Firstly, it’s interesting that 45% of urban adults support the Springboks and 16% have actually attended a decent amount of the games.
There is a 60/40 split between men and woman supporters and, within the group, 60% also support Currie Cup teams and 52% support South African Super Rugby teams.

There is a large group of active rugby players too. 600,000 urban adults (excludes school children) have played a game in the last 12 months and the average age of participation is fairly high at 36 years old.

There is a huge crossover between rugby and cricket (90% of cricket supporters and rugby supporters) but there is less of a cross over from soccer where only 48% of soccer supporters support the rugby.

Their media habits are different too. Mobile phones are 21% more likley to be considered an important medium for communication amongst rugby supporters – and this figure rises higher even for western province supporters to 48%.
29% of adults, all over South Africa, have watched a special rugby broadcast on TV. Rugby supporters are 3% more interested in reading about rugby in newspapers (45%) versus magazines (42%).

Rugby supporters are 19% more likely than most to research topics using the internet.

And, by far, the most listened to radio station by Springbok supporters is Metro FM.

why we love media

what clients see mostly are awesome presentations, hard-working campaigns, ah-ha moment insights, and clever ideas. what they don’t see are the hours and hours of analysis, meticulous planning, ideas sessions with media owners, tense negotiations, last-minute client bookings, and that moment when you figure out how to make a campaign work with champagne tastes on a beer budget. we love all this. it’s why we get up early in the morning and find it hard to switch off at night.


Infographic: Cape Town versus Joburg (media habits)

With so many creative agencies and publishers in Cape Town creating brand content (mostly advertising and magazine publishing) for a nation with a business and commerce hub in Greater Johannesburg, there is always a chance that marketing is viewed through a city-centric lens.

We have a look at what, objectively, makes the two cities so very different.

The data is sourced from 2,215 urban respondents living in Greater Johannesburg or Cape Town as well as all TomTom users compared to 200 cities around the world. Only data points with sufficiently stable sample sizes have been used.

cropped-TriColours.png

Subscribe To Our Newsletter

Join our mailing list to receive the latest media research updates.

You have Successfully Subscribed!